- Integrations
- Screenful
Create custom charts and scheduled reports from your Route5 data
Overview
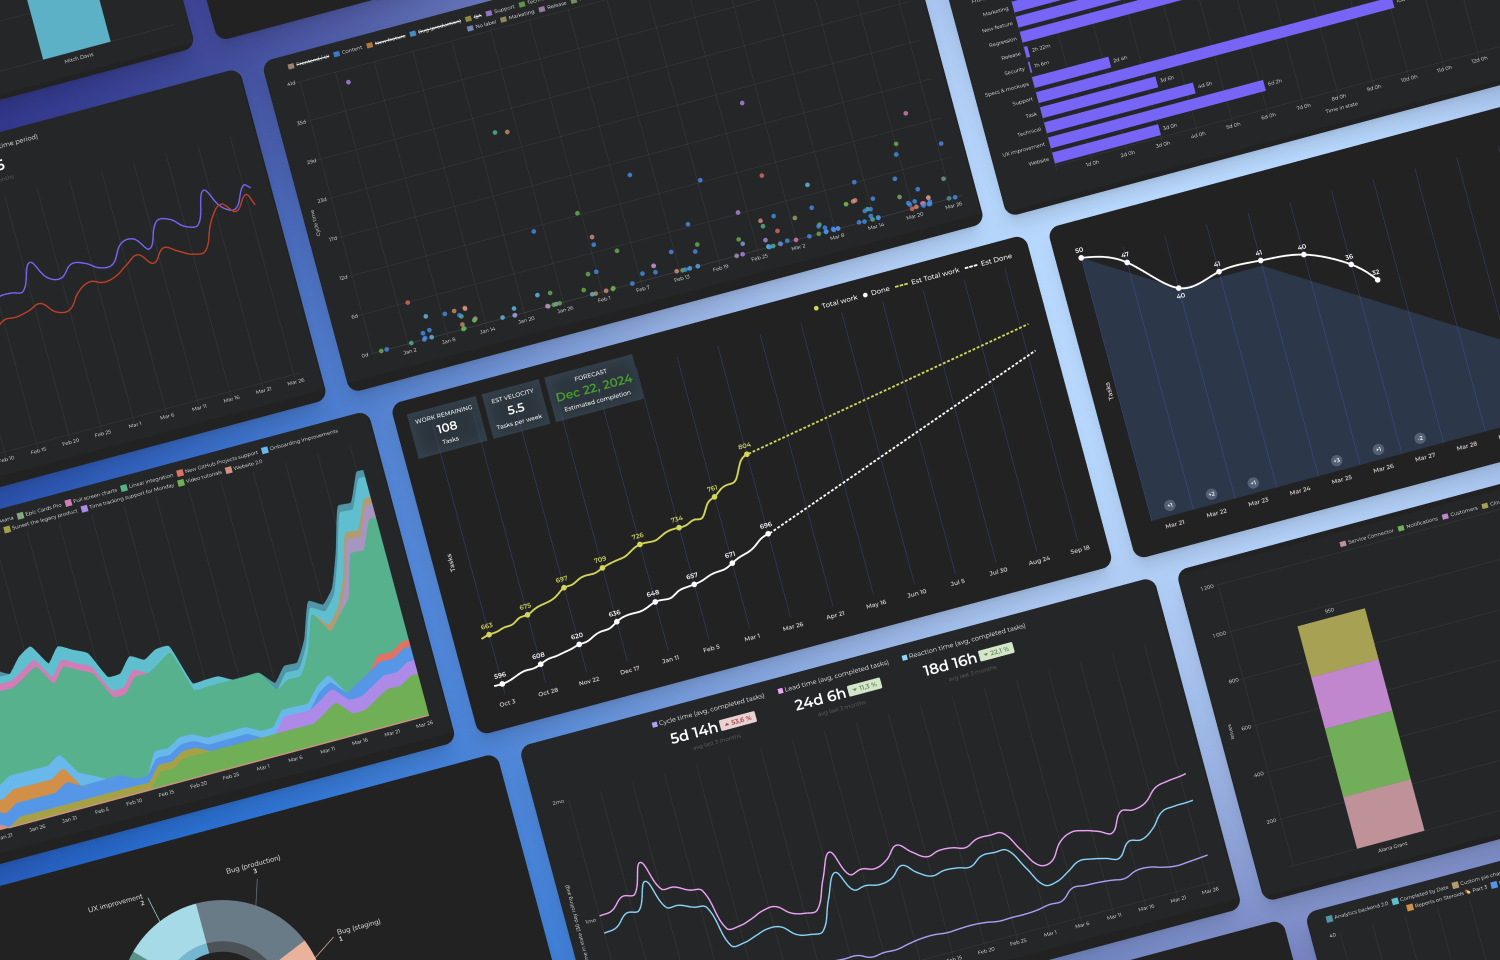
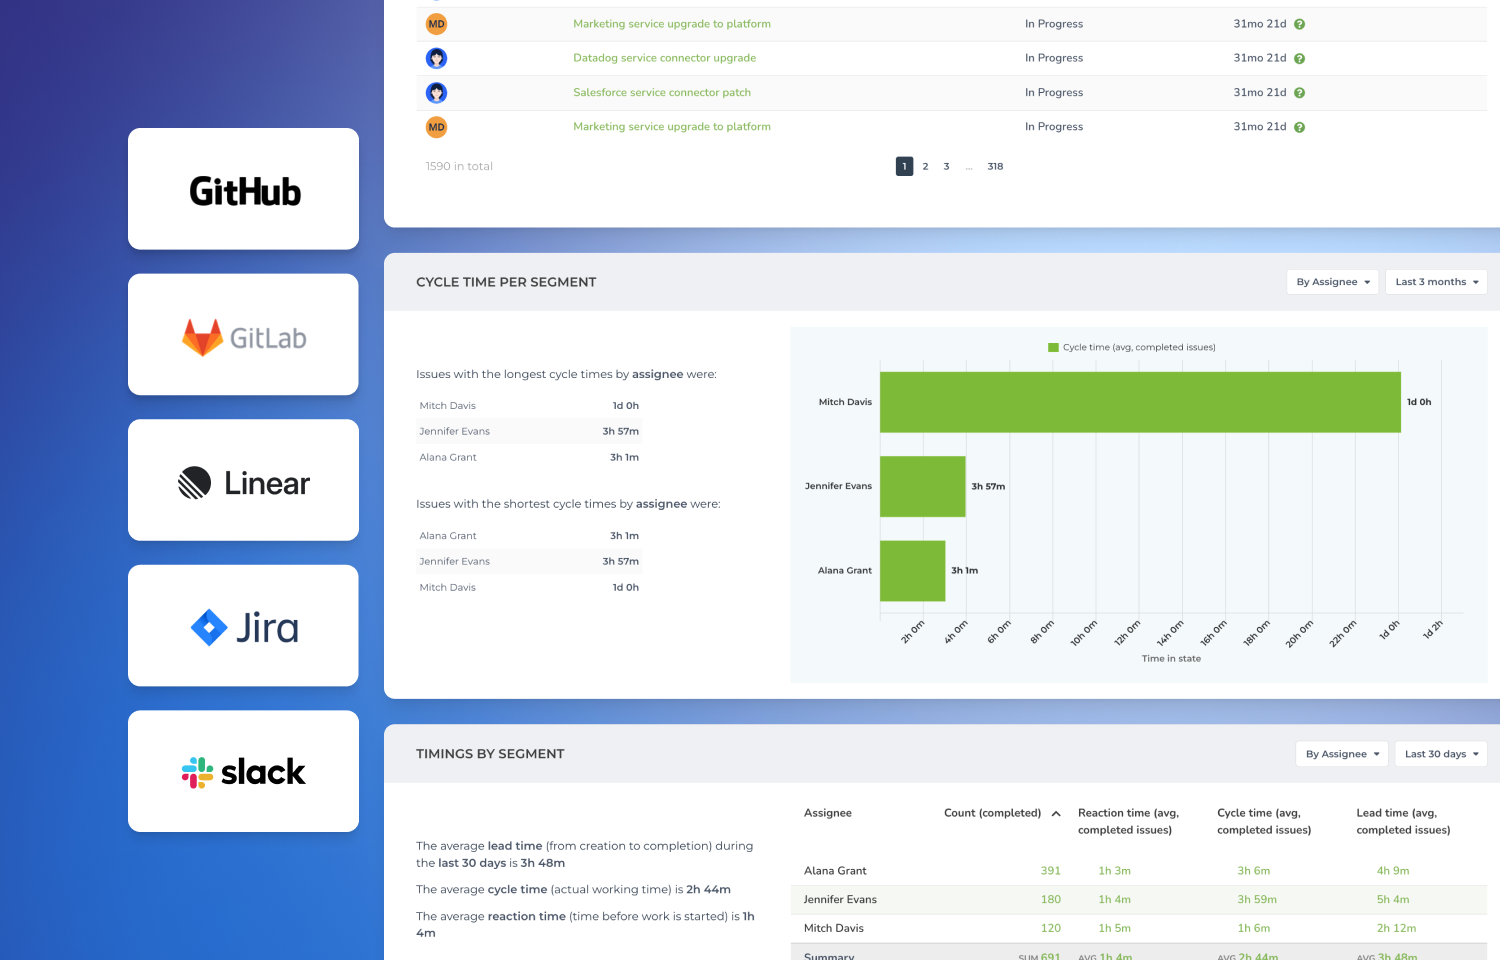
The Analytics & Reports by Screenful provides advanced analytics for Route5 data. Track cycle times, follow-through rate & throughput, and get forecasts for completing any work scope based on your team’s past performance. Create interactive charts and share them with others using share links or scheduled email reports. Combine insights from Route5, GitHub, GitLab, and Jira.
How it works
Integrating Screenful with Route5 is easy. Simply sign up for a Screenful account, connect your Route5 workspace, and Screenful will automatically import your issues, projects, and associated data.
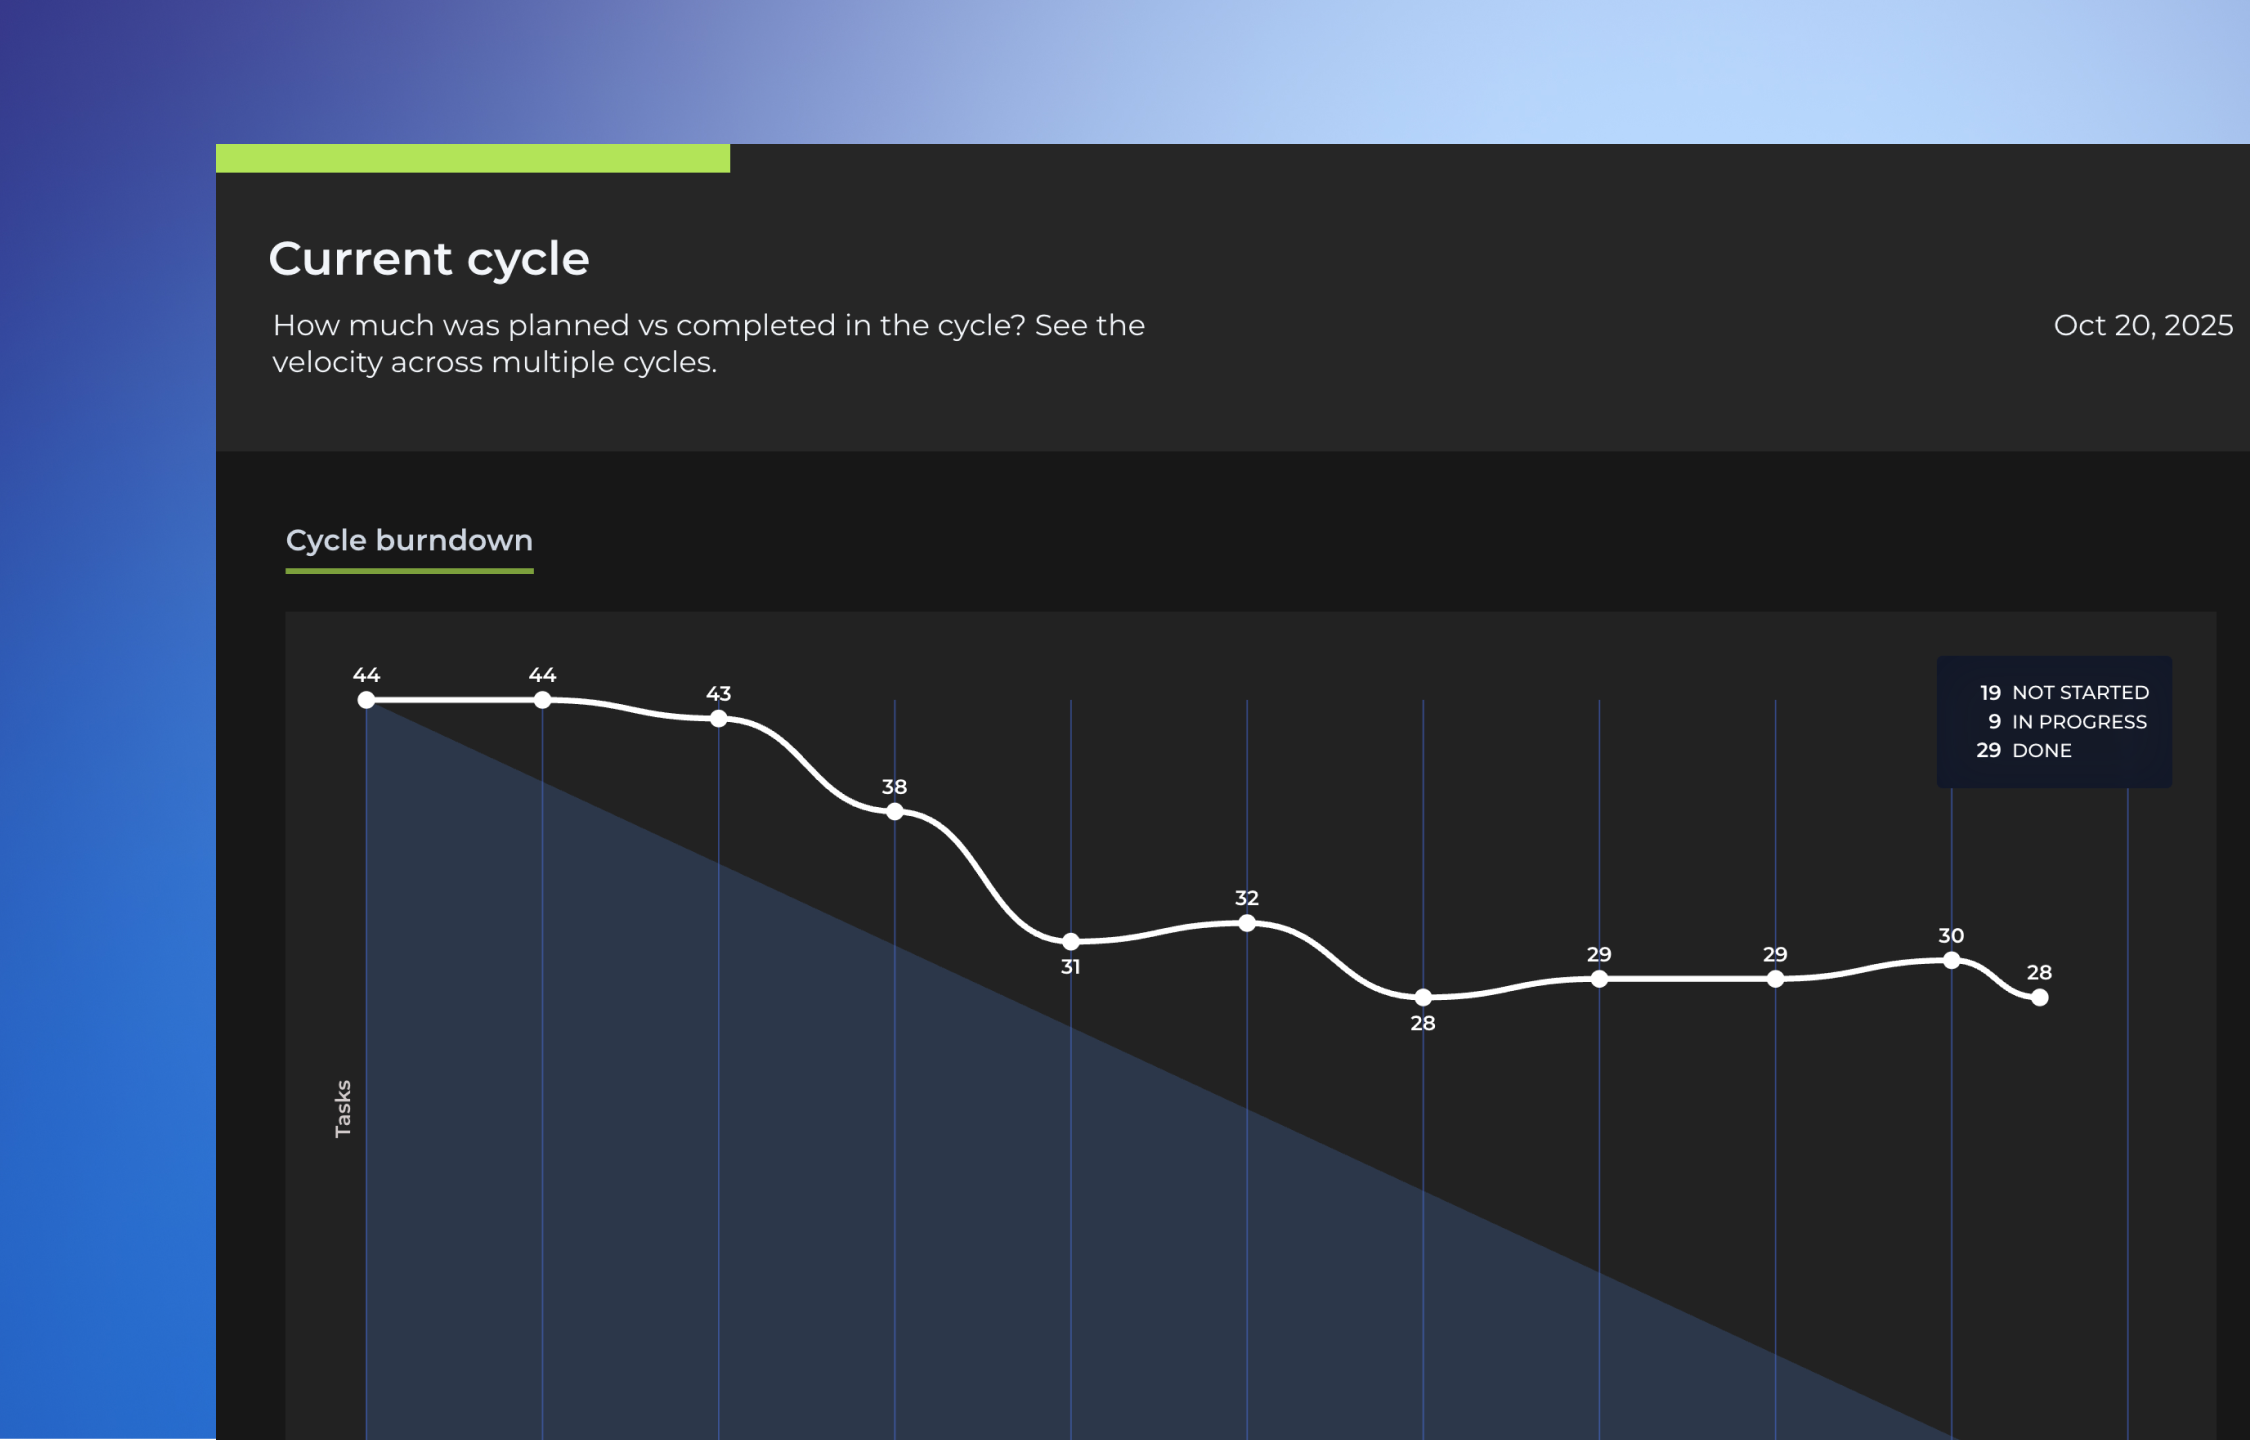
With Screenful, you can track metrics such as lead and cycle times, throughput, burndowns across any number of Route5 projects. You can slice & dice your data by setting filters and segments. You can also import data from other tools such as Jira, GitHub, and GitLab.
Share information with others by creating custom charts and placing them into reports that can be scheduled via email or Slack. Use the drag & drop editor to create that exact report you need. Finally you can keep everyone on the loop, also those who don’t log in to Route5 on a regular basis!
Configure
Create a Screenful account and follow the getting started guide.